Part 3 – Implementation
You are reading Part 3: Implementation.
🔗 Full implementation is available at: GhostDebug on GitHub
Implementation
In this chapter an overview of the requirements for the debugger is given first. Then the underlying architecture is described, with focus on the division into different components: a debugging core in the form of a Dynamic-Link Library (DLL), i.e., a Windows module, and a control unit operated via a console interface. Programming languages and communication mechanisms between the modules are discussed, including the protocols for message exchange and how the debugger process controls the target process. It is shown how the modules interact to set breakpoints, intercept exceptions, and perform other interventions in running code.
It is also explained how the debugger is initialized, i.e., which steps must be executed after program start. The main point is how the injectable DLL is loaded into the target process. The detailed implementation of these steps is described in the following sections.
Requirements and Goals
The following requirements are defined for the debugger:
-
Native debugging core (DLL) The debugger must have an injectable library (DLL) that runs in the target process and provides the actual debugging functionality. This is necessary because VEH only works within the same process. The DLL is loaded into the target process and takes control, for example by setting and handling breakpoints. The core is implemented in C++ for direct operating system access and for features like classes and templates.
-
Console interface for control In addition to the native core, a standalone console program must exist to send commands to the debugger. This separation between mechanism and user interface simplifies development and allows integration into automated scripts and toolchains. The console interface can accept commands like setting breakpoints, reading registers, or executing single instructions, and it prints out the target process state. The console is implemented in C# using the .NET framework.
-
Undetectability by anti-debugging methods A central goal is that common anti-debugging checks show no sign of active debugging. Programs that check
BeingDebuggedor a debug port must not find indicators. Therefore, classical Win32 Debugging APIs are avoided, and exceptions are handled with VEH. -
Support for x86_64 processes Since modern Windows systems run on 64-bit architectures, support for 64-bit processes is essential. The debugger must set breakpoints, perform single-stepping, and inspect memory in the 64-bit address space. Registers such as RIP, RSP, or RAX must be interpreted and manipulated.
-
Software breakpoints (INT 3) The debugger must be able to set software breakpoints anywhere in code by inserting an
INT 3instruction. Management includes setting, removing, and restoring the original instruction. -
Single-stepping For detailed analysis the debugger must support single-stepping, executing one instruction at a time. This is essential for reverse engineering, especially of protected applications. Implementation requires manipulating the Trap Flag (TF) in CPU registers so that every instruction generates an exception back to the debugger [Intel 2024].
These requirements form the foundation for the architecture and implementation.
Debugger Architecture
The structure of the debugger is based on a clear separation between the debug core and a console application.
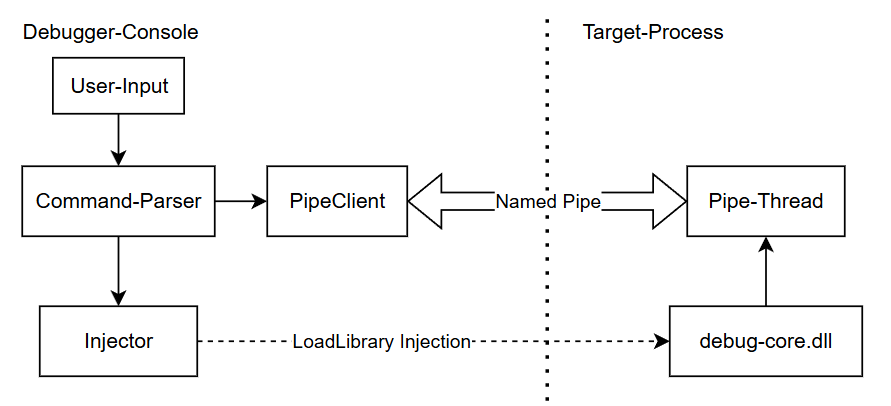 Figure 2: Schematic structure of the debugger with injectable DLL and console application
In the console application all control and initialization tasks are performed. For example, when the user chooses to debug a process, the application injects the debug core into the target. The DLL registers a vectored exception handler to intercept all usermode exceptions and starts a Named Pipe server to communicate with the console.
This creates a role separation: the console acts as coordinator, while the injected DLL operates in the target process.
DLL Injection with LoadLibrary
To start the debug core in the target process, the console uses the function LoadLibrary. It allocates memory in the target, writes the path of debug-core.dll, and creates a remote thread with CreateRemoteThread. This thread runs LoadLibrary with the path as parameter, so the target loads the DLL [Elastic 2017].
After injection, the DLL initializes itself: it creates a pipe thread that listens on a Named Pipe, and it registers the vectored exception handler. Breakpoints (INT 3) and single-step exceptions are thus forwarded directly to the debugger without using debug ports or debug objects.
Communication with Named Pipes and JSON Protocol
While the DLL runs in the target, the console parses user commands. Example: bp 0xC0DEC0DE
This creates a breakpoint at address 0xC0DEC0DE. First, an internal command parser in the console interprets the text and recognizes that a breakpoint should be set. Then the parser builds a JSON message from the input. The property "event" contains the code of the command to execute (for example 0 = ADD_BREAKPOINT), while the property "data" contains further information depending on the event type, such as the target address.
This message is sent through an asynchronous named pipe to the debugger DLL. Windows supports overlapped I/O, which means that read and write operations are performed non-blocking. In this way, the console application can send new commands without waiting for the target program to respond [Stevewhims 2022]. Conversely, the DLL can also immediately send back events, for example when a breakpoint is hit (2 = BREAKPOINT_HIT). Such an event includes not only the breakpoint address but also the CPU context (register values).
Through this asynchronous communication with named pipes, deadlocks between the debugger and the debugged program are avoided. While the console waits for input or performs other tasks, the injected DLL can always send a message about a triggered breakpoint. The pipe thread inside the target process processes incoming commands and responds appropriately without blocking. This ensures that spontaneous events are forwarded instantly to the console and displayed there.
As a result, a scalable debugger design emerges. The core runs completely in user mode of the target process and avoids the typical Win32 Debug APIs. The JSON-based protocol over named pipes enables extensive control and data exchange without making the presence of a debugger obvious.
Debugging Core
To maintain a clear structure for managing multiple breakpoints, an object-oriented approach is used. A Breakpoint class is created. Its instances contain the address of the breakpoint, the original machine code at that address, and methods to enable or disable the breakpoint. Each active breakpoint is stored in a C++ unordered_map, referenced by its address for fast access. Because multiple threads may access the breakpoint manager at the same time, mutexes are used to make it thread-safe. This prevents race conditions where two threads access the same breakpoint simultaneously [Dooley & Kazakova 2024].
To set a software breakpoint, an INT 3 instruction is placed at the target position in the code. This requires overwriting the original instruction at that address. To restore execution later, the overwritten byte is saved beforehand. Since code sections in Windows are usually not writable, memory protection must be adjusted temporarily. Here, the function VirtualProtect is used. It changes the access rights of a memory page to PAGE_EXECUTE_READWRITE, which allows overwriting. After writing, the original permissions are restored [MS Docs: VirtualProtect 2024].
The following example shows how an INT 3 breakpoint is placed:
1
2
3
4
5
6
7
8
9
10
11
12
13
void place_int3(uintptr_t address, uint8_t* originalByte)
{
    // Store the original instruction
    *originalByte = ((uint8_t*)address)[0];

    // Write the breakpoint
    DWORD oldProtect;
    VirtualProtect((void*)address, 0x1000, PAGE_EXECUTE_READWRITE, &oldProtect);

    ((uint8_t*)address)[0] = INT3;

    VirtualProtect((void*)address, 0x1000, oldProtect, &oldProtect);
}
Exception Handler and Register Context
When an exception occurs, the vectored exception handler in the DLL is called. Windows provides an EXCEPTION_POINTERS structure containing an EXCEPTION_RECORD (with exception address) [MS Docs: EXCEPTION_POINTERS 2024], [MS Docs: EXCEPTION_RECORD 2022]. If it is a breakpoint exception, the address is checked against the breakpoint map.
The CONTEXT structure includes all registers (RIP, RSP, general registers, XMM registers) [MS Docs: CONTEXT 2022]. The debugger sends this info through the pipe to the console. The thread causing the exception is paused until the user continues.
Resume Execution after Breakpoints
A main challenge was the correct continuation of execution while keeping the breakpoint active at the same location. For the processor to execute the interrupted instruction, the debugger must first disable the breakpoint by restoring the original bytecode at that address. At the same time, the Trap Flag (TF) in the CONTEXT structure is set. This ensures that after the next instruction is executed, an immediate exception (EXCEPTION_SINGLE_STEP) is triggered.
The following code example shows how this is implemented for the RESUME command:
1
2
3
4
5
6
7
8
9
10
11
12
13
14
15
16
17
18
19
20
21
22
case DEBUG_ACTION::RESUME:
{
    bp->disable();

    // Relate the current breakpoint to this thread
    // so we can restore INT3 after the single step
    {
        std::lock_guard<std::mutex> step_over_lock(thread_restore_mutex);
        thread_restore_breakpoints[thread_id] = bp;
    }

    // Indicate that we want to resume execution after the trap
    bp->single_step = false;
    thread_single_step[thread_id] = false;

    // Reset execution to original breakpoint address
    ctx->Rip = exception_address;
    // Set TF to reactivate the breakpoint on the next instruction
    SET_STEP_FLAG(ctx);

    return EXCEPTION_CONTINUE_EXECUTION;
}
Here, the breakpoint is removed and the instruction pointer (RIP) is reset to the original address. Then the Trap Flag is enabled in the processor registers. This makes the CPU execute exactly one instruction and immediately trigger another exception. The debugger recognizes this second exception, checks the thread-specific entry in the breakpoint-restore map, and reactivates the breakpoint unless the user requested another step. In this way, the program continues execution after the breakpoint as intended.
As an extension of this principle, the user can also issue a Single-Step command instead of resuming fully. In this case, the Trap Flag remains set, and after each instruction the debugger can inspect or modify the context.
To restore the breakpoint after a single-step, the following routine is used. When the EXCEPTION_SINGLE_STEP exception occurs, it checks whether a saved breakpoint must be restored for the current thread:
1
2
3
4
5
6
7
8
9
10
11
12
13
14
15
16
17
18
19
20
21
22
23
24
25
26
auto it = thread_restore_breakpoints.find(thread_id);
if (it != thread_restore_breakpoints.end())
{
    // Restore the breakpoint
    auto bp = it->second;
    bp->enable();

    // If single_step is set, continue stepping;
    // otherwise, clear it
    if (bp->single_step)
    {
        // Keep trap flag and mark thread as single step
        bp->single_step = false;
        SET_STEP_FLAG(ctx);
        thread_single_step[thread_id] = true;
    }
    else
    {
        // Resume execution normally
        CLEAR_STEP_FLAG(ctx);
        thread_restore_breakpoints.erase(it);
        return EXCEPTION_CONTINUE_EXECUTION;
    }

    thread_restore_breakpoints.erase(it);
}
In this routine, the breakpoint is first re-enabled by placing INT 3 back at the address. If the single_step flag is set, the processor stays in single-step mode. Otherwise, the Trap Flag is cleared and normal execution continues. Finally, the entry is removed from the thread-specific breakpoint map, ensuring that no repeated restoration occurs on the next SINGLE_STEP.
Debugging the Debugger Core
A problem is debugging the debugger itself. Because it relies on VEH, an external debugger attached to the process catches the exceptions first. The vectored handler in the DLL never receives them.
As a workaround, debugging of the debugger core was done by printing with printf or pausing execution with getchar(). This is not convenient, but it allows bug fixing.