Part 1 – Theory
You are reading Part 1: Theory.
🔗 The debugger project itself can be found here: GhostDebug on GitHub
Introduction
Debuggers are important tools in software development and in reverse engineering. They make it possible to analyze program execution, find errors, and gain deeper insights into the flow of software. In the context of software development, debuggers help developers to trace faulty program runs, inspect variable values, and identify runtime errors. Especially in security-critical applications, efficient debugging is essential to detect errors early and to ensure system stability [Dooley & Kazakova 2024].
Besides software development, debugging also plays a decisive role in reverse engineering, especially in security research and malware analysis. Reverse engineers use debuggers to analyze the behavior of unknown or intentionally obfuscated software. [Kim et al. 2019]. However, traditional debuggers on Windows are often easy for software to detect. Programs, especially malware or software with protection mechanisms, use techniques to detect debuggers and to disturb or block their work. Known methods for debugger detection include checking the function IsDebuggerPresent API, reading the Process Environment Block (PEB), or timing attacks to identify runtime delays [Ferrie 2011].
An alternative approach is the use of Vectored Exception Handling (VEH), a less known method for handling exceptions in Windows processes [MS Docs: Vectored Exception Handling 2021]. VEH makes it possible to intercept exceptions before they are processed by the standard Structured Exception Handling (SEH). This technique can be used to implement debugging mechanisms that are not so easily recognized by typical anti-debugging techniques.
Objectives and Scope
The goal of this work is the development of a debugger for Windows that can be detected less easily than conventional solutions. The focus is on the use of VEH, in contrast to the standard debugging methods based on the Win32 debugging APIs such as DebugActiveProcess or WaitForDebugEvent [MS Docs: Debugging Functions 2023]. These API-based methods rely on explicit communication between debugger and operating system and are therefore especially vulnerable to detection mechanisms. In contrast, VEH operates independently of the classical Windows debugging infrastructure and can therefore be hidden more effectively.
The final debugger will consist of two components:
- A command-line based control interface that allows the user to operate debugging functions.
- A debugging core that interacts directly with the target process.
This architecture allows flexible control and makes it easier to integrate the debugger into existing analysis and reverse engineering workflows.
Basics of Debugging
A debugger is a basic tool to control and analyze a running program during execution. Originally, such tools were mainly used to find errors in the development process by diagnosing runtime errors and identifying unwanted program flows. A debugger can capture current execution variables: it allows reading and changing memory contents, viewing CPU registers, and analyzing the call stack that shows the sequence of function calls. In this way developers can study program states, stop a concrete instruction, and analyze code lines step by step [Dooley & Kazakova 2024].
Debugging is also used in reverse engineering, where usually no source code of the software is available. Instead, the program logic is reconstructed from compiled machine code. With breakpoints the execution can be stopped step by step, so that even complex routines can be analyzed in detail. This is especially relevant for the analysis of malicious or strongly obfuscated software, because protection mechanisms can be uncovered.
To realize program stops, so-called breakpoints are used. They can be divided into two types:
- Software breakpoints: created by inserting special instructions into the program code. On x86 systems the opcode
INT 3is often used, which triggers an interrupt when executed. This method is flexible but changes the code at the breakpoint address. - Hardware breakpoints: based on dedicated debug registers (e.g. DR0–DR7 on x86/x64), which allow monitoring certain memory addresses or ranges. As soon as the program accesses such an address, execution stops automatically. This works without overwriting instructions and is useful when memory modification is not possible.
In addition to these breakpoint mechanisms, many debuggers provide further functions to analyze software in detail. These include showing complex data structures, as well as logging and visualization tools. A debugger can either start the target program itself or attach to an already running process to intervene directly.
In reverse engineering, these analysis options make it possible to understand even complex or intentionally obfuscated programs. By repeatedly setting and removing breakpoints, executing critical routines step by step, and reading the corresponding registers and memory states, the internal functionality and control flow of a program can be revealed. Especially in malware analysis this is essential to understand malicious code and to develop countermeasures [Branco & Shamir 2010].
In this context, exceptions can also be used as triggers to stop program execution. While classic debugging interfaces are often easy to detect, exception-based approaches offer new ways to perform analysis without being obvious to the target program. In this way, extensive inspection and control functions can be provided that are necessary for a thorough program analysis.
Debugging Interfaces
The standard method on Windows systems to observe and control a running program is based on functions provided by the Win32 Debugging API. These functions are used by common tools such as x64dbg or WinDbg and enable “classic” debugging behavior. This includes attaching to a running process, intercepting relevant events (for example the creation of new threads or the occurrence of an exception), and continuing program execution after inspection.
Central functions of the Win32 Debugging API are for example:
- DebugActiveProcess: Attaches to a running process so that debugging actions can be performed.
- WaitForDebugEvent: Waits for debugging events such as an exception or the start of a new thread. When an event occurs, the debugger can inspect execution.
- ContinueDebugEvent: Signals the operating system that the debugged program may continue at the stopped position.
- DebugBreakProcess: Triggers an exception in the target process so that the debugger takes control [MS Docs: Debugging Functions 2023].
Together these functions ensure that a debugger can monitor important events and states of the target process. Normally the Win32 Debugging API depends on close cooperation with the operating system, which delivers data and exceptions to the debugger. But this also makes it possible for the target process or third-party software to detect the debugger by checking certain flags or API usage.
A similar mechanism exists on Unix/Linux systems with the ptrace system call. On Linux the debugging functionality is realized by the operating system through signals that control the behavior of the target process. A debugger such as gdb can use ptrace to set breakpoints or to step through execution with PTRACE_SINGLESTEP. Every stop is reported by the kernel to the debugger. The role of these interfaces is the same as in Windows: the operating system passes process starts, thread creation, and exceptions to the debugger and allows intervention [Brand 2017].
Although the implementations differ, in both Windows and Linux the use of these APIs is the “normal” way to debug. The operating system explicitly recognizes the debugger and provides all control functions. But this close cooperation also makes the presence of a debugger easy to detect, for example by checking debugger-specific flags or by using the corresponding APIs. The topic of detection is discussed later in detail.
Exception Handling in Windows
Exception handling in Windows follows a multi-step process that includes both kernel mode and user mode. The question of whether a debugger is attached to the process plays a central role, because all exceptions can be handled through this mechanism. An example of an exception trigger is the INT 3 opcode, often used as a software breakpoint. When executed, it causes an interrupt, switching the thread from user mode to kernel mode. Control then reaches the function KiDispatchException. From this point processing continues in several steps, as shown in Figure 1.
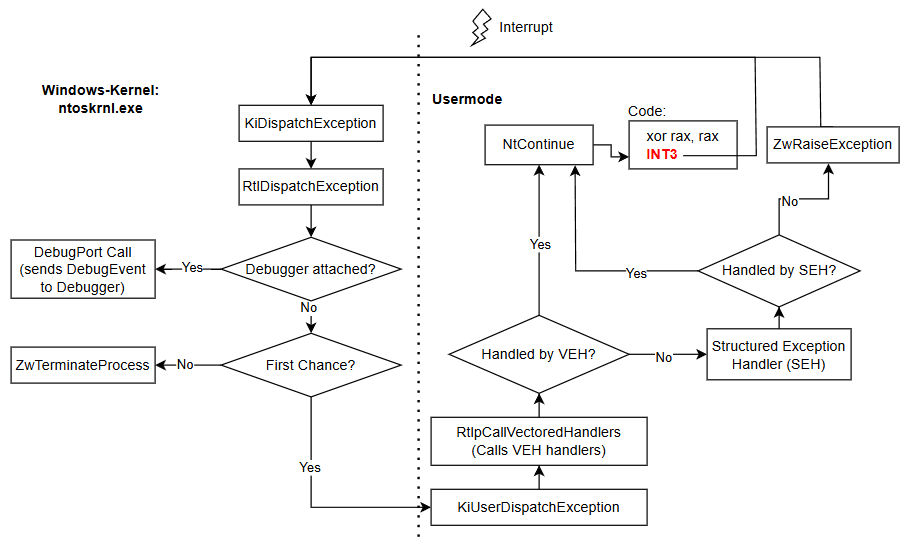 Figure 1: Schematic flow of exception handling in Windows focusing on usermode exceptions
In the kernel, KiDispatchException is called first, which internally calls RtlDispatchException. This function checks if a debugger is attached by verifying if a valid debug port is stored in the process object. If a debugger exists, it is notified through Local Procedure Call (LPC), a mechanism for communication between kernel and user mode. The exact behavior of LPC in this case is mostly undocumented [Russinovich 2009]. The debugger can then take interactive actions to inspect or ignore the exception.
If no debugger is present, the system checks whether it is a First Chance Exception. A First Chance Exception is the first time an exception occurs and may still be caught by a handler. If it is not handled, the system usually calls ZwTerminateProcess, which ends the process if no special mechanisms are in place [ReactOS: KiUserDispatchException n.d.].
When no more kernel interaction is needed, control goes to the routine KiUserDispatchException in ntdll.dll. There, RtlpCallVectoredHandlers is called, which runs through all registered vectored exception handlers [ReactOS: KiDispatchException n.d.]. These handlers are part of the broader Structured Exception Handling (SEH) system, which is the fundamental mechanism for exception handling in Windows.
Vectored Exception Handling (VEH)
Vectored Exception Handling gives global access to every exception as soon as it reaches user mode. This makes it possible to intercept exceptions before classical SEH processes the stack-based handlers. This ability makes VEH especially useful for debugging and monitoring, since all exceptions can be captured without depending on a specific function context. Handlers are registered with the function AddVectoredExceptionHandler, where it can be chosen whether the handler is placed at the beginning (first) or the end (last) of the handler chain [MS Docs: AddVectoredExceptionHandler 2024].
After RtlpCallVectoredHandlers is called, each registered handler can analyze the exception and return one of several values:
- EXCEPTION_CONTINUE_SEARCH: The VEH did not handle the exception, so the next handler in the chain is called (this may be another VEH or SEH).
- EXCEPTION_CONTINUE_EXECUTION: The exception was handled successfully, and execution should continue at the original instruction (via
NtContinue). - EXCEPTION_EXECUTE_HANDLER: Indicates that a following SEH handler may take over [MS Docs: Vectored Exception Handler 2021].
If neither a VEH nor SEH handler catches the exception, the system calls ZwRaiseException again, but now not as a First Chance Exception. The process usually ends or enters an error state if no other mechanism intervenes.
Vectored Exception Handling makes it possible to intercept all exceptions of a process and thus provides many possibilities for manipulation and monitoring. A debugger that registers itself as VEH acts as a top-level instance and can control every exception directly, without being detected by typical debugger detection methods. This gives a VEH-based debugger good camouflage, since most anti-debugging checks focus on standard APIs.